For Immediate Release: October 6, 2020
The Alexandria Health Department (AHD) has published an expanded analysis of data on COVID-19 cases in Alexandria. In addition to the monthly ZIP code data analyses AHD has published since May, the analysis provided in September and October summarizes current data and changes for race, ethnicity and age groups.
Updated ZIP Code Data
As of October 5, the Virginia Department of Health (VDH) has reported the following cumulative COVID-19 cases (the City of Alexandria has provided the estimated population for each local ZIP code to compare the number of cases per 1,000 residents).
Cumulative ZIP Code Data Summaries (by month)
| ZIP Code | Estimated Population (in Alexandria portion of zip code) | Date of Report | Confirmed Cases per ZIP Code | Total People Tested | Positivity Rate 1 | Tests per 1,000 Alexandria Residents | Confirmed Cases per 1,000 Alexandria residents |
| 22206 | 530 |
| |||||
| 22301 | 15,171 | May 7 4 | 35 | 282 | 12.4% | 18.6 | 2.3 |
| June 9 | 68 | 685 | 9.9% | 45.2 | 4.5 | ||
| July 7 | 90 | 1,106 | 8.1% | 72.9 | 5.9 | ||
| Aug 5 | 98 | 1,760 | 5.6% | 116.0 | 6.5 | ||
| Sept 5 | 127 | 2,618 | 4.9% | 172.6 | 8.4 | ||
| Oct 5 | 146 | 3,471 | 4.2% | 228.8 | 9.6 | ||
| 22302 | 20,238 | May 7 4 | 101 | 378 | 26.7% | 18.7 | 5.0 |
| June 9 | 220 | 1,364 | 16.1% | 67.4 | 10.9 | ||
| July 7 | 252 | 2,636 | 9.6% | 130.3 | 12.5 | ||
| Aug 5 | 285 | 3,592 | 7.9% | 177.5 | 14.1 | ||
| Sept 5 | 356 | 4,736 | 7.5% | 234.0 | 17.6 | ||
| Oct 5 | 415 | 6,163 | 6.7% | 304.5 | 20.5 | ||
| 22304 | 54,003 | May 7 4 | 296 | 1,142 | 25.9% | 21.1 | 5.5 |
| June 9 | 611 | 3,418 | 17.9% | 63.3 | 11.3 | ||
| July 7 | 707 | 4,873 | 14.5% | 90.2 | 13.1 | ||
| Aug 5 | 851 | 7,098 | 12.0% | 131.4 | 15.8 | ||
| Sept 5 | 1,074 | 9,923 | 10.8% | 183.7 | 19.9 | ||
| Oct 5 | 1,220 | 12,632 | 9.7% | 233.9 | 22.6 | ||
| 22305 | 16,095 | May 7 4 | 317 | 572 | 55.4% | 35.5 | 19.7 |
| June 9 | 572 | 1,899 | 30.1% | 118.0 | 35.5 | ||
| July 7 | 594 | 2,414 | 24.6% | 150.0 | 36.9 | ||
| Aug 5 | 656 | 3,239 | 20.3% | 201.2 | 40.8 | ||
| Sept 5 | 723 | 4,236 | 17.1% | 263.2 | 44.9 | ||
| Oct 5 | 794 | 5,129 | 15.5% | 318.7 | 49.3 | ||
| 22311 3 | 16,898 | May 7 4 | 190 3 | 517 3 | 36.8% 3 |
| |
| June 9 | 417 3 | 1,927 3 | 21.6% 3 | ||||
| July 7 | 464 3 | 2,502 3 | 18.5% 3 | ||||
| Aug 5 | 547 3 | 3,462 3 | 15.8% 3 | ||||
| Sept 5 | 643 3 | 5,059 3 | 12.7% 3 | ||||
| Oct 5 | 712 3 | 6,116 3 | 11.6% 3 | ||||
| 22312 3 | 6,901 | May 7 4 | 196 3 | 659 3 | 29.7% 3 | ||
| June 9 | 529 3 | 2,047 3 | 25.8% 3 | ||||
| July 7 | 616 3 | 2,989 3 | 20.6% 3 | ||||
| Aug 5 | 734 3 | 4,245 3 | 17.3% 3 | ||||
| Sept 5 | 908 3 | 6,004 3 | 15.1% 3 | ||||
| Oct 5 | 1,010 3 | 7,548 3 | 13.4% 3 | ||||
| 22314 | 47,826 | May 7 4 | 113 | 687 | 16.4% | 14.4 | 2.4 |
| June 9 | 185 | 1,645 | 11.2% | 34.4 | 3.9 | ||
| July 7 | 216 | 2,594 | 8.3% | 54.2 | 4.5 | ||
| Aug 5 | 265 | 4,142 | 6.4% | 86.6 | 5.5 | ||
| Sept 5 | 343 | 6,276 | 5.5% | 131.2 | 7.2 | ||
| Oct 5 | 423 | 8,248 | 5.1% | 172.5 | 8.8 | ||
1 The positivity rate is the number of confirmed cases divided by the number of tests.
2 ZIP code 22206 is mostly in Arlington County; the City of Alexandria portion of data for 22206 is not provided, therefore the numbers and calculations would not be reliable for reporting for Alexandria.
3 ZIP codes 22311 and 22312 are shared between the City of Alexandria and Fairfax County. The number of cases and number of people tested presented in this table, and accompanying calculations, are for the entire ZIP code. Cases per 1,000 Alexandrians cannot be reliably calculated.
4 Data is cumulative from the onset of the pandemic to May 7, and includes cases and tests over a period greater than one month.
Significant Changes since September 5, 2020 Analysis Using Cumulative Data
As expected with ongoing community transmission of COVID-19, there has been an increase in cumulative positive cases per 1,000 residents. The range of rates in the September 5 analysis was 7.2 (in 22314) to 44.9 (in 22305), and the range in the October 5 analysis is 8.8 to 49.3, with the same ZIP codes having the highest and lowest confirmed cases.
All Alexandria ZIP codes have continued to experience decreases in their cumulative positivity rates since the May analysis. Positivity rates measure the percentage of tests conducted in a population that are positive. This measure is influenced by a number of factors, including how many tests are conducted, who is being tested, and how rapidly the virus is spreading. While there is no perfect measure to describe the burden of COVID-19 infections during this pandemic, positivity rate is a widely-used metric despite its limitations. Data presented in the table are based on information shared by VDH and is subject to change based on updates.
In the September analysis, the cumulative percent positivity ranged from 4.9% to 17.1%. In the October analysis, the range is 4.2% to 15.5%. The ZIP code with the highest cumulative positivity rates since May remains 22305, but this ZIP code has also experienced a 70% reduction in its cumulative positivity rate since the initial analysis. ZIP code 22301 continues to have the lowest cumulative positivity rate since May.
AHD and the City have worked with Alexandria’s healthcare providers and community partners to increase both testing availability and testing awareness across all ZIP codes in Alexandria. Timely testing is just one part of the multipronged pandemic response strategy, and prevention of new infections remains the priority. It is important for all members of the community to practice physical distancing, wear masks, wash hands frequently, and cooperate with case investigations and contact tracing when called by public health staff.
It is also important to look at the data monthly to understand the current state of the pandemic. The following analysis is a monthly snapshot of new cases and tests since the prior month’s report. Four ZIP codes (22301, 22302, 22304, and 22312) have experienced decreases, while three ZIP codes (22305, 22311, and 22314) have experienced increases in their positivity rates as noted in the October analysis.
Monthly ZIP Code Data Summaries
| ZIP Code | Estimated Population (in Alexandria portion of ZIP code) | Date of Report | Confirmed Cases per ZIP Code | Total People Tested | Positivity Rate 1 | Tests per 1,000 Alexandria Residents | Confirmed Cases per 1,000 Alexandria residents |
| 22206 | 530 |
| |||||
| 22301 | 15,171 | May 7 4 | 35 | 282 | 12.4% | 18.6 | 2.3 |
| June 9 | 33 | 403 | 8.2% | 26.6 | 2.2 | ||
| July 7 | 22 | 421 | 5.2% | 27.8 | 1.5 | ||
| Aug 5 | 8 | 654 | 1.2% | 43.1 | 0.5 | ||
| Sept 5 | 29 | 858 | 3.4% | 56.6 | 1.9 | ||
| Oct 5 | 19 | 853 | 2.2% | 56.2 | 1.3 | ||
| 22302 | 20,238 | May 7 4 | 101 | 378 | 26.7 | 18.7 | 5.0 |
| June 9 | 119 | 986 | 12.1% | 48.7 | 5.9 | ||
| July 7 | 32 | 1272 | 2.5% | 62.9 | 1.6 | ||
| Aug 5 | 33 | 956 | 3.5% | 47.2 | 1.6 | ||
| Sept 5 | 71 | 1,144 | 6.2% | 56.5 | 3.5 | ||
| Oct 5 | 59 | 1,427 | 4.1% | 70.5 | 2.9 | ||
| 22304 | 54,003 | May 7 4 | 296 | 1,142 | 25.9% | 21.1 | 5.5 |
| June 9 | 315 | 2,276 | 13.8% | 42.1 | 5.8 | ||
| July 7 | 96 | 1,455 | 6.6% | 26.9 | 1.8 | ||
| Aug 5 | 144 | 2,225 | 6.5% | 41.2 | 2.7 | ||
| Sept 5 | 223 | 2,825 | 7.9% | 52.3 | 4.1 | ||
| Oct 5 | 146 | 2,709 | 5.4% | 50.2 | 2.7 | ||
| 22305 | 16,095 | May 7 4 | 317 | 572 | 55.4% | 35.5 | 19.7 |
| June 9 | 255 | 1,327 | 19.2% | 82.4 | 15.8 | ||
| July 7 | 22 | 515 | 4.3% | 32.0 | 1.4 | ||
| Aug 5 | 62 | 825 | 7.5% | 51.3 | 3.9 | ||
| Sept 5 | 67 | 997 | 6.7% | 61.9 | 4.2 | ||
| Oct 5 | 71 | 893 | 8.0% | 55.5 | 4.4 | ||
| 22311 3 | 16,898 | May 7 4 | 190 3 | 517 3 | 36.8% 3 |
| |
| June 9 | 227 3 | 1,410 3 | 16.1% 3 | ||||
| July 7 | 47 3 | 575 3 | 8.2% 3 | ||||
| Aug 5 | 83 3 | 960 3 | 8.6% 3 | ||||
| Sept 5 | 96 3 | 1,597 3 | 6.0% 3 | ||||
| Oct 5 | 69 3 | 1,057 3 | 6.5% 3 | ||||
| 22312 3 | 6,901 | May 7 4 | 196 3 | 659 3 | 29.7% 3 | ||
| June 9 | 333 3 | 1,388 3 | 24.0% 3 | ||||
| July 7 | 87 3 | 942 3 | 9.2% 3 | ||||
| Aug 5 | 118 3 | 1,256 3 | 9.4% 3 | ||||
| Sept 5 | 174 3 | 1,759 3 | 9.9% 3 | ||||
| Oct 5 | 102 3 | 1,44 3 | 6.6% 3 | ||||
| 22314 | 47,826 | May 7 4 | 113 | 687 | 16.4% | 14.4 | 2.4 |
| June 9 | 72 | 958 | 7.5% | 20.0 | 1.5 | ||
| July 7 | 31 | 949 | 3.3% | 19.8 | 0.6 | ||
| Aug 5 | 49 | 1,548 | 3.2% | 32.4 | 1.0 | ||
| Sept 5 | 78 | 2,134 | 3.7% | 44.6 | 1.6 | ||
| Oct 5 | 80 | 1,972 | 4.1% | 41.2 | 1.7 | ||
1 The positivity rate is the number of confirmed cases divided by the number of tests.
2 ZIP code 22206 is mostly in Arlington County; the Alexandria portion of data for 22206 is not provided, therefore the numbers and calculations would not be reliable for reporting for Alexandria.
3 ZIP codes 22311 and 22312 are shared between Alexandria and Fairfax County. The number of cases and number of people tested presented in this table, and accompanying calculations, are for the entire ZIP code. Cases per 1,000 Alexandrians cannot be reliably calculated.
4 Data is cumulative from the onset of the pandemic to May 7, and includes cases and tests over a period greater than one month.
Disproportionate Impact of COVID-19 by Race and Ethnicity
Everyone is at risk for COVID-19, but it has disproportionately affected vulnerable populations throughout the United States, in Virginia, regionally, and within our community due to underlying systemic problems. VDH has published data on COVID-19 cases by race and ethnicity since the middle of June. The following table and charts present the cumulative case data by month.
Cumulative Race and Ethnicity Data Summary
| Race or Ethnicity | Cumulative Cases as of July 5 | Cumulative Cases as of August 5 | Cumulative Cases as of September 5 | Cumulative Cases as of October 5 |
| Latino | 1306 (55.0%) | 1482 (51.6%) | 1656 (47.6%) | 1820 (46.3%) |
| Black | 347 (14.6%) | 524 (18.2%) | 703 (20.2%) | 816 (20.8%) |
| White | 451 (19.0%) | 531 (18.5%) | 672 (19.3%) | 770 (19.6%) |
| Asian or Pacific Islander | 84 (3.5%) | 99 (3.4%) | 121 (3.5%) | 139 (3.5%) |
| Other Race | 40 (1.7%) | 48 (1.7%) | 76 (2.2%) | 84 (2.1%) |
| Two or more races | 4 (0.2%) | 6 (0.2%) | 21 (0.6%) | 28 (0.7%) |
| Native American | 3 (0.1%) | 2 (0.1%) | 3 (0.1%) | 4 (0.1%) |
| Not Reported | 141 (5.9%) | 180 (6.3%) | 224 (6.4%) | 266 (6.8%) |
| Total | 2,376 | 2,872 | 3,476 | 3,927 |

Individuals who identify as Latino or Hispanic make up 16.8% of the population in Alexandria, but as of October 5, this community represents 46.3% of the diagnosed COVID-19 infections. There has been a decline in the proportion of cumulative COVID-19 infections diagnosed among Latinos over time.
Monthly New Case Race and Ethnicity Data
| Race | New cases from July 6-August 5 | New cases from August 6-September 5 | New cases from September 6-October 5 |
| Latino | 176 (35.5%) | 174 (28.8%) | 164 (36.4%) |
| Black | 177 (35.7%) | 179 (29.6%) | 113 (25.1%) |
| White | 80 (16.1%) | 141 (23.3%) | 98 (21.7%) |
| Asian or Pacific Islander | 15 (3.0%) | 22 (3.6%) | 18 (4.0%) |
| Other Race | 8 (1.6%) | 28 (4.6%) | 8 (1.8%) |
| Two or more races | 2 (0.4%) | 15 (2.5%) | 7 (1.6%) |
| Native American | 0 (0.0%) | 1 (0.2%) | 1 (0.2%) |
| Not Reported | 39 (7.9%) | 44 (7.3%) | 42 (9.3%) |
| Total | 496 | 604 | 451 |
When looking at COVID-19 cases diagnosed from September 6 through October 5, 25.1% of cases were among individuals who identify as Black, which is a small decrease from the prior month. Individuals who identify as Latino comprised 36.4% of cases during the same period, which is an increase from the prior month. The percentage of newly diagnosed people identifying as white slightly decreased in this monthly analysis, from 23.3% to 21.7%. If cases were proportionate by populations, AHD would expect to see whites with the highest number of cases with almost double the number of cases compared to the Black population.
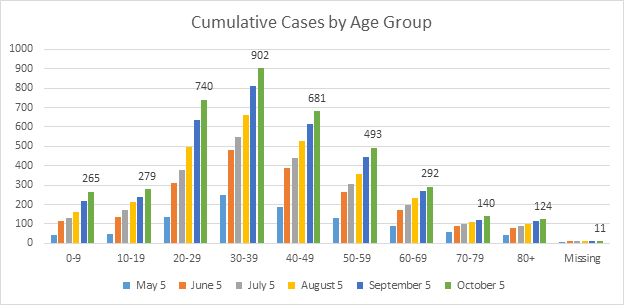
Disproportionate Impact of COVID-19 by Age
When looking at cumulative data, the largest proportion of cases continue to be among those 30 to 39 years old, which is to be expected based on Alexandria’s population.
Cumulative Age Data Summary
| Age (yrs) | May 5 | June 5 | July 5 | August 5 | September 5 | October 5 |
| 0-9 | 41 | 116 | 133 | 162 | 217 | 265 |
| 10-19 | 50 | 134 | 170 | 211 | 241 | 279 |
| 20-29 | 138 | 311 | 377 | 499 | 634 | 740 |
| 30-39 | 247 | 479 | 549 | 663 | 810 | 902 |
| 40-49 | 187 | 390 | 439 | 530 | 614 | 681 |
| 50-59 | 131 | 264 | 305 | 359 | 445 | 493 |
| 60-69 | 87 | 173 | 200 | 232 | 268 | 292 |
| 70-79 | 57 | 90 | 101 | 108 | 121 | 140 |
| 80+ | 44 | 78 | 90 | 97 | 115 | 124 |
| Missing | 1 | 10 | 12 | 11 | 11 | 11 |
| Total | 983 | 2,045 | 2,376 | 2,872 | 3,476 | 3,927 |
Monthly New Case Age Data Summary
Those who are 20 to 29 years old represent the largest proportion of new cases from September 6 to October 5. There was an increase in cases during this same time period seen among the 10 to 19 and 70 to 79 age groups.
| Age (yrs) | New Cases (May 6-June 5) | New Cases (June 6-July 5) | New Cases (July 6-Aug 5) | New Cases (Aug 6-Sept 5) | |
| 0-9 | 75 | 17 | 29 | 55 | 48 |
| 10-19 | 84 | 36 | 41 | 30 | 38 |
| 20-29 | 173 | 66 | 122 | 135 | 106 |
| 30-39 | 232 | 70 | 114 | 147 | 92 |
| 40-49 | 203 | 49 | 91 | 84 | 67 |
| 50-59 | 133 | 41 | 54 | 86 | 48 |
| 60-69 | 86 | 27 | 32 | 36 | 24 |
| 70-79 | 33 | 11 | 7 | 13 | 19 |
| 80+ | 34 | 12 | 7 | 18 | 9 |
| Missing | 9 | 2 | 0 | 0 | 0 |
| Total | 1,062 | 331 | 496 | 604 | 451 |

What the Alexandria Health Department is Doing
AHD is a mission-driven organization whose response to this pandemic is consistent with its public health justice principles. AHD has developed and continues to update Strategic Action Frameworks that guide efforts and help prepare for evolving challenges.
AHD activities in the past month to combat the COVID-19 pandemic include:
Conducted annual flu vaccination clinics on September 26 and October 3 and administered over 1,800 flu vaccines. This represents a four-fold increase in the number of vaccinations provided in prior years’ clinics. Anyone who has not yet gotten the flu vaccine this year should schedule an appointment with their physician or pharmacy, or visit the flu page for more information.
Preparing to distribute a COVID-19 vaccine equitably and efficiently once a safe vaccine is available.
Responding to cases and outbreaks in the community. AHD case investigators and contact tracers work seven days a week to help minimize the spread of COVID-19 infection. AHD is analyzing aggregate data on cases to help inform best infection prevention practices.
Providing technical support to Neighborhood Health to organize and coordinate weekly targeted testing events for communities who may not have otherwise had access to testing and for those who have been exposed to a positive COVID-19 case. AHD analyzes data and identifies these communities based on need. There are five testing events in October and AHD and the City maintain resources regarding testing facilities in Alexandria and surrounding areas where Alexandrians can get tested any day of the week.
Supporting City agencies, faith based organizations, schools, daycares, and governmental leadership with recommendations based on up-to-date COVID-19 epidemiology and research.
Responding to complaints about businesses not adhering to the Governor’s Executive Order and supporting businesses in their commitment to the ALX Promise.
© 1995–2022 City of Alexandria, VA and others • Privacy & Legal • FOIA Requests