For Immediate Release: August 7, 2020
The Alexandria Health Department (AHD) has published an expanded analysis of data on COVID-19 cases in Alexandria. In addition to the monthly ZIP code data analyses AHD has published since May, the new analysis summarizes current data and changes for race, ethnicity and age groups. Relevant charts and key takeaways at a glance are also available.
Updated ZIP Code Data
The City of Alexandria has provided the estimated population for each local ZIP code to compare the number of cases per 1,000 residents. As of August 5, the Virginia Department of Health (VDH) has reported the following cumulative COVID-19 cases.
Analysis by Cumulative ZIP Code Data
| ZIP Code | Estimated Population (in Alexandria portion of ZIP code) | Date of Report | Confirmed Cases per ZIP Code | Total People Tested | Positivity Rate 1 | Tests per 1,000 Alexandria Residents | Confirmed Cases per 1,000 Alexandria residents |
| 22206 | 530 |
| |||||
| 22301 | 15,171 | May 7 | 35 | 282 | 12.4% | 18.6 | 2.3 |
| June 9 | 68 | 685 | 9.9% | 45.2 | 4.5 | ||
| July 7 | 90 | 1,106 | 8.1% | 72.9 | 5.9 | ||
| Aug 5 | 98 | 1,760 | 5.6% | 116.0 | 6.5 | ||
| 22302 | 20,238 | May 7 | 101 | 378 | 26.7 | 18.7 | 5.0 |
| June 9 | 220 | 1,364 | 16.1% | 67.4 | 10.9 | ||
| July 7 | 252 | 2,636 | 9.6% | 130.3 | 12.5 | ||
| Aug 5 | 285 | 3,592 | 7.9% | 177.5 | 14.1 | ||
| 22304 | 54,003 | May 7 | 296 | 1,142 | 25.9% | 21.1 | 5.5 |
| June 9 | 611 | 3,418 | 17.9% | 63.3 | 11.3 | ||
| July 7 | 707 | 4,873 | 14.5% | 90.2 | 13.1 | ||
| Aug 5 | 851 | 7,098 | 12.0% | 131.4 | 15.8 | ||
| 22305 | 16,095 | May 7 | 317 | 572 | 55.4% | 35.5 | 19.7 |
| June 9 | 572 | 1,899 | 30.1% | 118.0 | 35.5 | ||
| July 7 | 594 | 2,414 | 24.6% | 150.0 | 36.9 | ||
| Aug 5 | 656 | 3.239 | 20.3% | 201.2 | 40.8 | ||
| 22311 3 | 16,898 | May 7 | 190 3 | 517 3 | 36.8% 3 |
| |
| June 9 | 417 3 | 1,927 3 | 21.6% 3 | ||||
| July 7 | 464 3 | 2,502 3 | 18.5% 3 | ||||
| Aug 5 | 547 3 | 3,462 3 | 15.8% 3 | ||||
| 22312 3 | 6,901 | May 7 | 196 3 | 659 3 | 29.7% 3 | ||
| June 9 | 529 3 | 2,047 3 | 25.8% 3 | ||||
| July 7 | 616 3 | 2,989 3 | 20.6% 3 | ||||
| Aug 5 | 734 3 | 4,245 3 | 17.3% 3 | ||||
| 22314 | 47,826 | May 7 | 113 | 687 | 16.4% | 14.4 | 2.4 |
| June 9 | 185 | 1,645 | 11.2% | 34.4 | 3.9 | ||
| July 7 | 216 | 2,594 | 8.3% | 54.2 | 4.5 | ||
| Aug 5 | 265 | 4,142 | 6.4% | 86.6 | 5.5 | ||
1 The positivity rate is the number of confirmed cases divided by the number of tests.
2 ZIP code 22206 is mostly in Arlington County; the City of Alexandria portion of data for 22206 is not provided, therefore the numbers and calculations would not be reliable for reporting for Alexandria.
3 ZIP codes 22311 and 22312 are shared between the City of Alexandria and Fairfax County. The number of cases and number of people tested presented in this table, and accompanying calculations, are for the entire ZIP code. Cases per 1,000 Alexandrians cannot be reliably calculated.
4 Data is cumulative from the onset of the pandemic to May 7, and includes cases and tests over a time period greater than one month.
Significant Changes since July 7, 2020, Analysis Using Cumulative Data
As expected with ongoing community transmission of COVID-19 in the region, there has been an increase in cumulative positive cases per 1,000 residents. The range of rates in the July analysis was 4.5 to 36.9 confirmed cases per 1,000 residents, and the range in the August analysis is 5.5 to 40.8 confirmed cases per 1,000 residents.
All Alexandria ZIP codes have continued to experience a significant decrease in their cumulative positivity rates since the May analysis. Positivity rates measure what percentage of tests conducted in a community are positive. This measure is influenced both by how many tests are conducted and by how rapidly the virus is spreading. While there is no perfect measure to describe the burden of COVID-19 infections during this pandemic, positivity rate is a widely used metric despite its limitations.
In the July analysis, the cumulative percent positivity rate ranged from 8.1% to 24.6%. In the August analysis, the range was 5.6% to 20.3%. The ZIP code with the highest cumulative positivity rates since May remains 22305, but this ZIP code has also experienced more than a 50% reduction in its cumulative positivity rate since the May analysis. ZIP code 22301 had the lowest cumulative positivity rate and the largest reduction (31.3%) in the cumulative positivity rate from the July to August analyses.
Due to efforts by AHD and the City, there have been increases in testing and testing awareness across all ZIP codes in Alexandria since May. ZIP codes 22301 and 22314 have both experienced more than 50% increases in tests per 1,000 residents since last month’s analysis. Timely testing is just one part of the multipronged pandemic response strategy, and prevention of new infections remains the priority. It is important for all members of the community to practice physical distancing, wear masks, wash hands frequently, and cooperate with case investigations and contact tracing if called by public health staff.
It is also important to look at the data incrementally (e.g., daily, weekly, monthly) to be aware of the current state of the pandemic. The following analysis is a monthly snapshot of new cases and tests since the prior month’s report. Multiple ZIP codes (22302, 22305, 22311, 22312) have experienced recent increases in their monthly positivity rates.
Analysis by Monthly New Case ZIP Code Data
| ZIP Code | Estimated Population (in Alexandria portion of ZIP code) | Date of Report | Confirmed Cases per ZIP Code | Total People Tested | Positivity Rate 1 | Tests per 1,000 Alexandria Residents | Confirmed Cases per 1,000 Alexandria residents |
| 22206 | 530 |
| |||||
| 22301 | 15,171 | May 7 4 | 35 | 282 | 12.4% | 18.6 | 2.3 |
| June 9 | 33 | 403 | 8.2% | 26.6 | 2.2 | ||
| July 7 | 22 | 421 | 5.2% | 27.8 | 1.5 | ||
| Aug 5 | 8 | 654 | 1.2% | 43.1 | 0.5 | ||
| 22302 | 20,238 | May 7 4 | 101 | 378 | 26.7 | 18.7 | 5.0 |
| June 9 | 119 | 986 | 12.1% | 48.7 | 5.9 | ||
| July 7 | 32 | 1,272 | 2.5% | 62.9 | 1.6 | ||
| Aug 5 | 33 | 956 | 3.5% | 47.2 | 1.6 | ||
| 22304 | 54,003 | May 7 4 | 296 | 1,142 | 25.9% | 21.1 | 5.5 |
| June 9 | 315 | 2,276 | 13.8% | 42.1 | 5.8 | ||
| July 7 | 96 | 1,455 | 6.6% | 26.9 | 1.8 | ||
| Aug 5 | 144 | 2,225 | 6.5% | 41.2 | 2.7 | ||
| 22305 | 16,095 | May 7 4 | 317 | 572 | 55.4% | 35.5 | 19.7 |
| June 9 | 255 | 1,327 | 19.2% | 82.4 | 15.8 | ||
| July 7 | 22 | 515 | 4.3% | 32.0 | 1.4 | ||
| Aug 5 | 62 | 825 | 7.5% | 51.3 | 3.9 | ||
| 22311 3 | 16,898 | May 7 4 | 190 3 | 517 3 | 36.8% 3 |
| |
| June 9 | 227 3 | 1,410 3 | 16.1% 3 | ||||
| July 7 | 47 3 | 575 3 | 8.2% 3 | ||||
| Aug 5 | 83 3 | 960 3 | 8.6% 3 | ||||
| 22312 3 | 6,901 | May 7 4 | 196 3 | 659 3 | 29.7% 3 | ||
| June 9 | 333 3 | 1,388 3 | 24.0% 3 | ||||
| July 7 | 87 3 | 942 3 | 9.2% 3 | ||||
| Aug 5 | 118 3 | 1,256 3 | 9.4% 3 | ||||
| 22314 | 47,826 | May 7 4 | 113 | 687 | 16.4% | 14.4 | 2.4 |
| June 9 | 72 | 958 | 7.5% | 20.0 | 1.5 | ||
| July 7 | 31 | 949 | 3.3% | 19.8 | 0.6 | ||
| Aug 5 | 49 | 1,548 | 3.2% | 32.4 | 1.0 | ||
1 The positivity rate is the number of confirmed cases divided by the number of tests.
2 ZIP code 22206 is mostly in Arlington County; the City of Alexandria portion of data for 22206 is not provided, therefore the numbers and calculations would not be reliable for reporting for Alexandria.
3 ZIP codes 22311 and 22312 are shared between the City of Alexandria and Fairfax County. The number of cases and number of people tested presented in this table, and accompanying calculations, are for the entire ZIP code. Cases per 1,000 Alexandrians cannot be reliably calculated.
4 Data is cumulative from the onset of the pandemic to May 7, and includes cases and tests over a time period greater than one month.
Disproportionate Impact of COVID-19 by Race and Ethnicity
Everyone is at risk for COVID-19, but the virus has disproportionately affected vulnerable populations within our community due to underlying systemic issues. VDH has published data on COVID-19 cases by race and ethnicity since the middle of June. The following table and charts present the same cumulative case data in several formats for readers’ ease.
Analysis by Cumulative Race and Ethnicity Data
| Race | Cumulative Cases as of June 29 | Cumulative Cases as of July 13 | Cumulative Cases as of July 27 | Cumulative Cases as of August 5 |
| Other Race | 39 (1.7%) | 43 (1.8%) | 46 (1.7%) | 48 (1.7%) |
| Not Reported | 135 (5.8%) | 143 (5.8%) | 165 (6.0%) | 180 (6.3%) |
| White | 443 (19.1%) | 464 (18.9%) | 508 (18.6%) | 531 (18.5%) |
| Black | 333 (14.4%) | 370 (15.1%) | 463 (16.9%) | 524 (18.2%) |
| Two or more races | 4 (0.2%) | 5 (0.2%) | 6 (0.2%) | 6 (0.2%) |
| Latino | 1,277 (55.1%) | 1,344 (54.7%) | 1,451 (53.1%) | 1,482 (51.6%) |
| Asian or Pacific Islander | 83 (3.6%) | 85 (3.5%) | 94 (3.4%) | 99 (3.4%) |
| Native American | 3 (0.1%) | 2 (0.1%) | 2 (0.1%) | 2 (0.1%) |
| Total | 2,317 | 2,456 | 2,735 | 2,872 |


Individuals who identify as Latino or Hispanic makeup 16.8% 5 of the population in Alexandria, but as of August 5, this community represents 51.6% of cumulative diagnosed COVID-19 infections and 44.9% 6 of cumulative hospital admissions due to COVID-19.
When looking at the cumulative cases over time stratified by race and ethnicity, there is a slight decreasing trend observed in the percentage of cases among those who identify as Latino or Hispanic. This improvement, while small, may be an early reflection of AHD, City, and community partner efforts.
It is also important to note that there is a slight increasing trend in the proportion of cumulative cases among those who identify as Black. Moreover, when looking at the monthly analysis, the proportion of cases among those who identify as Black is 35.1% while only making up 21.9% 7 of the City’s population. If cases were distributed equitably based on population composition, AHD would expect to see that whites have the highest number of cases, with almost double the number of cases compared to the Black population.
5 Population statistics were taken from 2019 estimates.
6 Data is not shown in this report.
7 Population statistics were taken from 2019 estimates.
Analysis by Monthly New Case Race and Ethnicity Data
| Race | New cases from July 6-August 5 |
| Other Race | 8 (1.6%) |
| Not Reported | 39 (7.9%) |
| White | 80 (16.1%) |
| Black | 177 (35.7%) |
| Two or more races | 2 (0.4%) |
| Latino | 176 (35.5%) |
| Asian or Pacific Islander | 15 (3.0%) |
| Native American | 0 (0.0%) |
| Total | 496 8 |
8 Based on the total number of cases reported by VDH as of August 5 (2,872) and July 5 (2,376), there were 496 new cases reported from July 6 to August 5. The sum of all cases in the chart is 497 because the cumulative number of positive COVID-19 cases reported by VDH among people who identify as Native American changed from 3 to 2.
Mortality by Race and Ethnicity
Since the beginning of the pandemic, the case fatality rate has been highest among individuals who identify as white. However, the mortality rate among persons identifying as Black or white are similar.
There are significant discrepancies in life expectancy in Alexandria by census tract, race, ethnicity and other factors. Since people who are older are more likely to die from COVID-19, and because Alexandria’s white population has a longer life expectancy on average, the white population would be expected to have a higher COVID-19 associated mortality. However, because the two mortality rates are similar, this is actually an inequity and represents a disproportionate burden of severe illness on Black residents. AHD is closely following these trends and working to provide immediate and proactive assistance to members of the community.
Disproportionate Impact of COVID-19 by Age
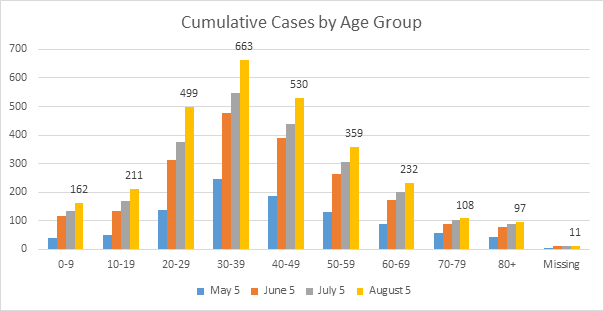
The majority of cases have occurred in those aged 20-39 years old. This age bracket represents almost half of all new cases in the past month. When looking at cumulative data, the largest proportion of cases are among those 30-39 years old, which is to be expected based on Alexandria’s population.
Analysis of Cases by Cumulative Age Data
| May 5 | June 5 | July 5 | August 5 | |
| 0-9 | 41 | 116 | 133 | 162 |
| 10-19 | 50 | 134 | 170 | 211 |
| 20-29 | 138 | 311 | 377 | 499 |
| 30-39 | 247 | 479 | 549 | 663 |
| 40-49 | 187 | 390 | 439 | 530 |
| 50-59 | 131 | 264 | 305 | 359 |
| 60-69 | 87 | 173 | 200 | 232 |
| 70-79 | 57 | 90 | 101 | 108 |
| 80+ | 44 | 78 | 90 | 97 |
| Missing | 1 | 10 | 12 | 11 |
| Total | 2,872 |
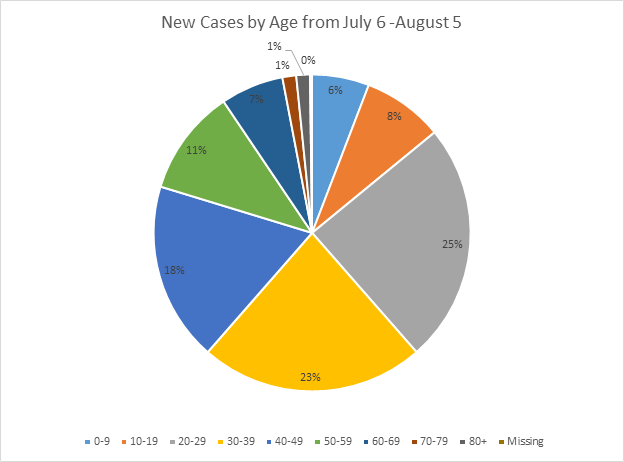
Analysis by Monthly New Case Age Data
The following analysis examines the change in cases per age group from June to July, and July to August. Those who are 20-29 represent the largest proportion of new cases from July 6 to August 5. This same age group, along with those 40-49, had the highest percent changes in cases from the previous month. There was also a large percentage increase seen in the 0-9 age group.
Percentage Change in New Cases
| June to July | July to August | |
| 0-9 | -77.3% | 70.6% |
| 10-19 | -57.1% | 13.9% |
| 20-29 | -61.8% | 84.8% |
| 30-39 | -69.8% | 62.9% |
| 40-49 | -75.9% | 85.7% |
| 50-59 | -69.2% | 31.7% |
| 60-69 | -68.6% | 18.5% |
| 70-79 | -66.7% | -36.4% |
| 80+ | -64.7% | -41.7% |
| Missing | -77.8% | -150.0% |
What the Alexandria Health Department is Doing
AHD is a mission-driven organization whose response to this pandemic is consistent with public health justice principles. AHD continues to develop and update Strategic Action Plans that guide efforts and help prepare for future challenges. The most recent Strategic Action Plan, to help prepare for the distribution of a COVID-19 vaccine, was released last week.
AHD activities in the past month to combat the COVID-19 pandemic include:
Virginia entered Phase Three of reopening on July 1, and AHD has taken steps to avoid losing ground due to uncontrolled spread of the virus. AHD continues to support businesses who have made the
ALX Promise, and AHD staff have made unannounced site visits to restaurants and bars to enforce the Governor’s executive orders on face coverings, crowding and other guidelines. AHD has conducted targeted outreach to small, women and minority-owned businesses, particularly in Alexandria’s high-positivity rate ZIP codes, to promote the ALX Promise program and to provide free signage that corresponds to the executive orders.
The pandemic has led to decreases in routine vaccinations since March. AHD has been increasing immunization clinic appointment availability to accommodate the increased need for catch-up vaccinations. Everyone is encouraged to remain up-to-date on vaccinations and schedule visits with their primary care physicians, or call the AHD immunization clinic at 703.746.4888.
AHD provided technical support to Neighborhood Health to organize targeted testing events for communities who may not have otherwise had access to testing. AHD analyzes data and has identified these communities based on need and burden of infections.
AHD provides focused support to schools and daycares by reviewing reopening plans, communicating best practices, and providing clear guidance on how to handle COVID-19 related concerns that are consistent with U.S. Centers for Disease Control and Prevention guidelines.
AHD is providing proactive and responsive technical assistance and support to vulnerable communities living in long-term care facilities, congregate living homes, and residential buildings.
AHD is reviewing data with community partners to identify which additional interventions or strategies would be appropriate.
AHD continues to perform quality case investigations and contract tracing as community transmission increases, and shares accurate knowledge and advice with community partners, City colleagues, other government officials, and members of the community on the rapidly evolving research and recommendations related to COVID-19.
© 1995–2022 City of Alexandria, VA and others • Privacy & Legal • FOIA Requests