[Archived] Question # 56: Please provide updated comparator information charts for Police, Fire, Sheriff and General Scale employees using FY 2021 Proposed budgets.
Question: Please provide updated comparator information charts for Police, Fire, Sheriff and General Scale employees using FY 2021 Proposed budgets. Please provide the total numbers of employees/positions in each comparator chart. (Mayor Wilson, Councilman Aguirre, Councilwoman Jackson)
Response:
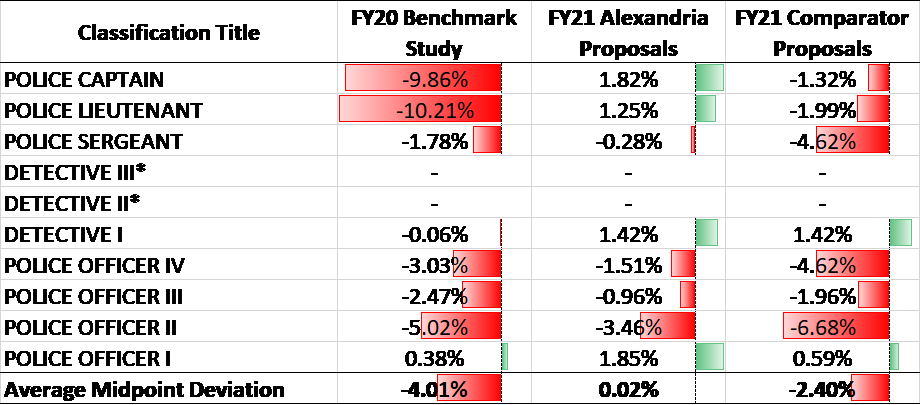
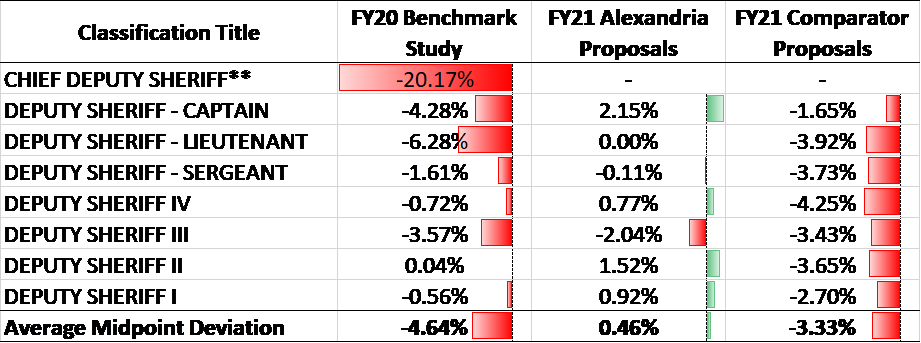
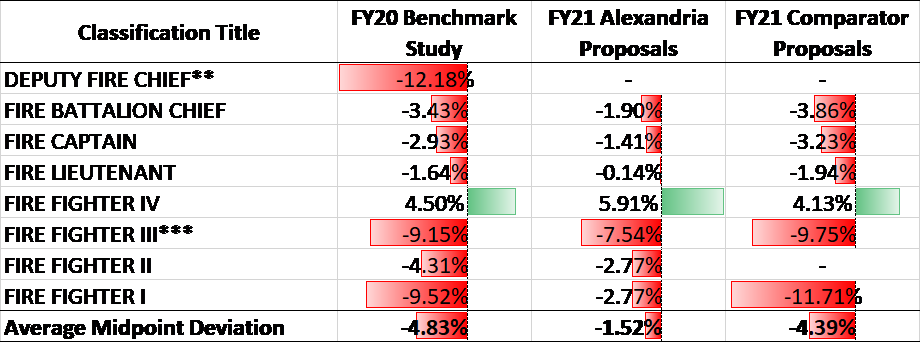
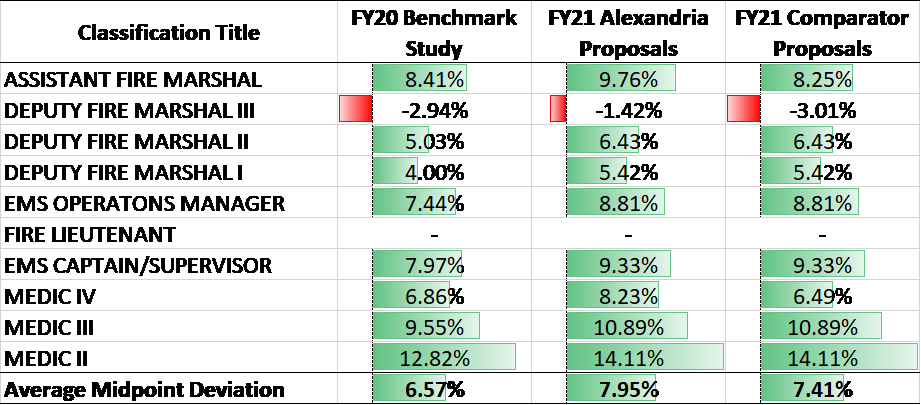
The charts on the following pages depict pay comparisons based on the FY 2021 original proposed budgets. The comparator charts reflect the pay comparisons based on the following:
- The results of the Traditional Comparator Benchmark Study, which depict comparison of average midpoints for approved FY 2020 pay ranges for both the City of Alexandria and the comparator jurisdictions. These results are in Column “FY 2020 Benchmark Study” of each chart.
- Comparison of the compensation enhancements in the City of Alexandria’s originally proposed FY 2021 budget against the FY 2020 compensation in the comparator jurisdictions. This comparison of average midpoints is included in the Column labeled “FY 2021 Alexandria Proposals”.
- Pay comparison based on the compensation changes as originally proposed in the City of Alexandria’s and the comparator jurisdictions’ FY 2021 budgets. The results of this comparison of average midpoints is in Column “FY 2021 Comparator Proposals”.
With Budget revision 2.0, these compensation changes originally proposed, including the 1.5% pay scale increase, have been eliminated in the FY 2021 budget due to the ongoing public health crisis and one resulting in a dramatic drop in revenues.
It should be noted that most, if not nearly all, of the proposed compensation enhancements by the City’s comparator jurisdictions have been (or will be) eliminated in the budget to be adopted by these jurisdictions due to the impact of COVID-19 on local revenues, so pay differentials will stay roughly as shown under the FY 2020 Benchmark Study column in the following pages.
Public Safety Pay Competitiveness: Police
Based on the results of the Traditional Comparator Benchmark Study, Police Captains and Police Lieutenants show the most significant deviation from the midpoint of the market that exceeds the City’s target of aligning with the average of the market (+/-5% of the average). Despite some classifications deviating from the average of the market, the average deviation of all classifications aligns with the market.
After accounting for the 1.5% increase to the pay scale and targeted increases of two grades each for Police Captains and Police Lieutenants included in the City’s originally proposed FY 2021 budget, all classifications on the police pay scale would be aligned with the midpoint of the market, and the average deviation from the midpoint would exceed the average by 0.02%.
After applying the City’s proposed 1.5% increase to the pay scale and targeted increases of two grades each for Police Captains and Police Lieutenants and accounting for the originally proposed FY21 compensation changes in the comparator jurisdictions, the average deviation from the midpoint falls within +/-5% of the average at -2.40%.

Public Safety Pay Competitiveness: Sheriff
Based on the results of the Traditional Comparator Benchmark Study, Chief Deputy Sheriff’s, Deputy Sheriff Captains and Deputy Sheriff Lieutenants show the most significant deviation from the midpoint of the market that exceeds the City’s target of aligning with the average of the market (+/-5% of the average). Despite some classifications deviating from the average of the market, the average deviation of all classifications aligns with the market.
After accounting for the 1.5% increase to the pay scale, moving the Chief Deputy Sheriff to the executive pay scale, and applying targeted increases of one grade for Deputy Sheriff Captains and Deputy Sheriff Lieutenants as included in the City’s originally proposed FY 2021 budget, all classifications on the sheriff pay scale would be aligned with the midpoint of the market and the average deviation from the midpoint exceeds the average by 0.46%.
After applying the proposed 1.5% increase to the pay scale, moving the Chief Deputy Sheriff to the executive pay scale, and applying targeted increases of one grade for Deputy Sheriff Captains and Deputy Sheriff Lieutenants and accounting for the originally proposed FY21 compensation changes in the comparator jurisdictions, the average deviation from the midpoint falls within +/-5% of the average at -3.33%.

Public Safety Pay Competitiveness: Fire
Based on the results of the Traditional Comparator Benchmark Study, Deputy Fire Chief’s and Firefighter I’s show the most significant deviation from the midpoint of the market that exceeds the City’s target of aligning with the average of the market (+/-5% of the average). Despite some classifications deviating from the average of the market, the average deviation of all classifications aligns with the market.
After accounting for the 1.5% increase to the pay scale, moving the Deputy Fire Chief to the executive pay scale, and applying a targeted increase of one grade for Firefighter I’s as included in the City’s originally proposed FY 2021 budget, the average deviation from the midpoint falls within +/-5% of the average at -1.52%.
After applying the proposed 1.5% increase to the pay scale, moving the Deputy Fire Chief to the executive pay scale, and applying a targeted increase of one grade for Firefighter I’s and accounting for the originally proposed FY21 compensation changes in the comparator jurisdictions, the average deviation from the midpoint falls within +/-5% of the average at -4.39%.

Public Safety Pay Competitiveness: Fire Marshals/Medics
Based on the results of the Traditional Comparator Benchmark Study, classifications on the Fire Marshal/Medic pay scales meet or exceed the average midpoint in the market.
After accounting for the 1.5% increase to the pay scale as included in the City’s originally proposed FY 2021 budget, classifications on this pay scale continue to meet or exceed the average of the market, with the average deviation from the midpoint exceeding the average by 7.95%. As noted below there are substantial positive deviations for single-role medics. This statistic is not meaningful as there are few single role medic positions in the DC region as nearly all of the region is on a dual role status.
After applying the proposed 1.5% increase to the pay scale and accounting for the originally proposed FY21 compensation changes in the comparator jurisdictions, classifications on this pay scale continue to meet or exceed the average of the market, with the average deviation from the midpoint exceeding the average by 7.41%.

General Schedule Pay Competitiveness
The average deviation of benchmarked classifications on the general pay scale are currently aligned with the average of the midpoint of the market at -4.06% (within +/-5% of the average).
After accounting for the 1.5% increase to the pay scale as included in the City’s originally proposed FY 2021 budget, the average deviation from the midpoint is aligned with the average at -2.52%.
After applying the proposed 1.5% increase to the pay scale and accounting for the originally proposed FY21 compensation changes in the comparator jurisdictions, the average deviation from the midpoint falls within +/-5% of the average at -4.26%.
