[Archived] Question # 25: Update of the summary pay comparator charts showing the results of the compensation recommendations included in the proposed budget.
Question:
Update of the summary pay comparator charts showing the results of the compensation recommendations included in the proposed budget. (City Manager Jinks)
Response:
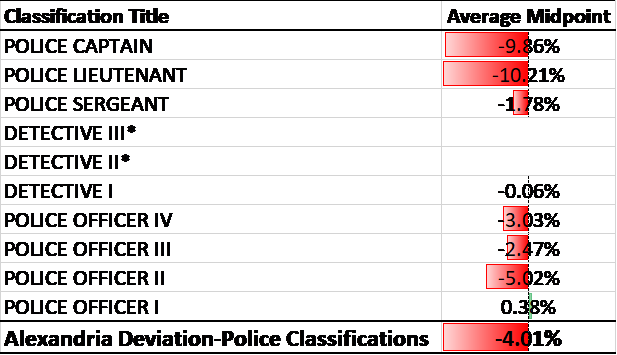
Public Safety Pay Competitiveness: Police
Results of Traditional Comparator Benchmark Study
Police Captains and Police Lieutenants show the most significant deviation from the midpoint of the market that exceeds the City’s target of aligning with the average of the market (+/-5% of the average). The City’s compensation policy states that “Pay programs are intended to be competitive at a minimum with the average pay of comparator organizations in the primary labor market.” Despite some classifications deviating from the average of the market, the average deviation of all classifications for the pay program aligns with the market.
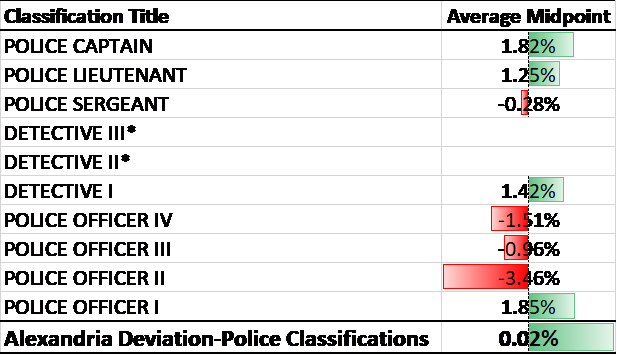
Benchmark Results After Proposed Increases to Police Pay Scale***
After applying the proposed 1.5% increase to the pay scale and targeted increases of two grades each for Police Captains and Police Lieutenants, all classifications on the police pay scale would be aligned with the midpoint of the market, and the average deviation from the midpoint exceeds the average by 0.02%.
Public Safety Pay Competitiveness: Sheriff
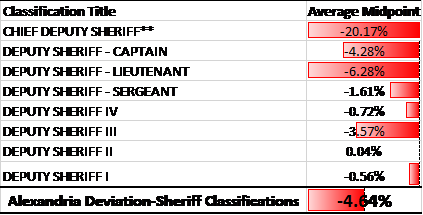
Results of Northern Virginia Comparator Benchmark Study
Chief Deputy Sheriff’s, Deputy Sheriff Captains and Deputy Sheriff Lieutenants show the most significant deviation from the midpoint of the market that exceeds the City’s target of aligning with the average of the market (+/-5% of the average). Despite some classifications deviating from the average of the market, the average deviation of all of these classifications aligns with the market.
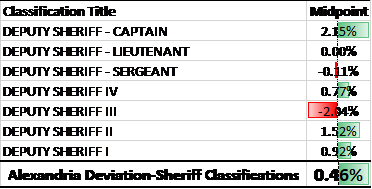
Benchmark Results After Proposed Increases to Sheriff Pay Scale***
After applying the proposed 1.5% increase to the pay scale, moving the Chief Deputy Sheriff to the executive pay scale, and applying targeted increases of one grade for Deputy Sheriff Captains and Deputy Sheriff Lieutenants, all classifications on the sheriff pay scale would be aligned with the midpoint of the market and the average deviation from the midpoint exceeds the average by 0.46%.
Public Safety Pay Competitiveness: Fire
Results of Northern Virginia Comparator Benchmark Study
Deputy Fire Chief’s and Firefighter I’s show the most significant deviation from the midpoint of the market that exceeds the City’s target of aligning with the average of the market (+/-5% of the average). Despite some classifications deviating from the average of the market, the average deviation of all classifications aligns with the market.
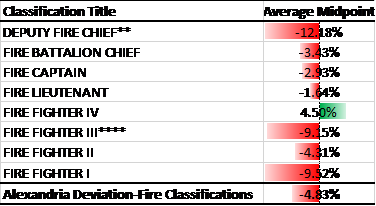
Benchmark Results After Proposed Increases to Fire Pay Scale***
After applying the proposed 1.5% increase to the pay scale, moving the Deputy Fire Chief to the executive pay scale, and applying a targeted increase of one grade for Firefighter I’s, the average deviation from the midpoint falls within +/-5% of the average at -1.52%.
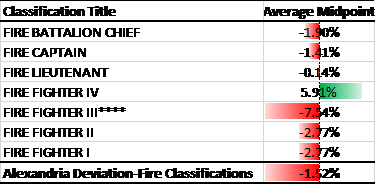
Public Safety Pay Competitiveness:
Fire Marshal/Medics
Results of Northern Virginia and Traditional Comparator
Benchmark Study
Classifications on the Fire Marshal/Medic pay scales meet or exceed the average midpoint in the market.
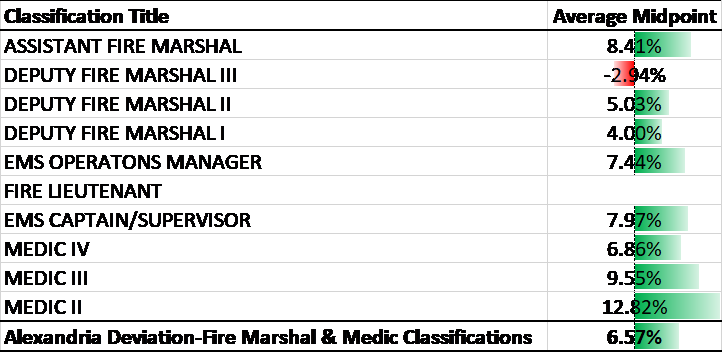
Benchmark Results After Proposed Increases to Fire Marshal/Medic Pay Scale***
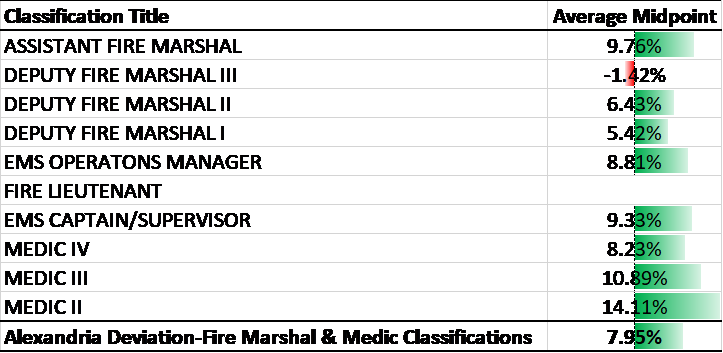
After applying the proposed 1.5% increase to the pay scale, classifications on this pay scale continue to meet or exceed the average of the market, with the average deviation from the midpoint exceeding the average by 7.95%. As noted below there are substantial positive deviations for single-role medics. This statistic is not meaningful as there are few single role medic positions in the DC region as nearly all of the region is on a dual role status.
General Schedule Pay Competitiveness
The average deviation of benchmarked classifications on the general pay scale are currently aligned with the average of the midpoint of the market at -4.06% (within +/-5% of the average). After applying the proposed 1.5% increase to the pay scale, the average deviation from the midpoint is aligned with the average at -2.52%.

* No equivalent matches identified in the comparator market.
**Classification is proposed to move to the Executive pay scale.
***Reflects proposed 1.5% increase to all pay scales in FY21.
****Does not reflect additional 3% in specialty pay that is provided in addition to the base pay rate.
