[Archived] Question #22: What were restaurant sales for last four years (gross totals) as in did they ever recover from when they were down? Did the average sales per business also go up?
Question:
What were restaurant sales for last four years (gross totals) as in did they ever recover from when they were down? Did the average sales per business also go up? (ie how many total businesses contributed and is that number up or down from the previous year?) What is the % increase in total number of restaurants or businesses that remit meals tax? What was our % population increase last year, and % increase in the number of jobs here? What is the commercial vacancy for the last four years? What was the retail sales revenue over last four years and in particular the first half of FY19? How do our trends compare to Arlington and Fairfax for the same periods and for last two periods? (Mayor Wilson, City Manager Jinks)
Response:
Based on the available data, increasing the Meals Tax rate from 4% to 5% has had no measurable impact on restaurant sales. This is comparable to the City’s experience in 2008, the last time the rate was changed, and comparable to other jurisdictions that have raised their Meals Tax rate. As noted at the time of adoption, the additional 1% rate added approximately $0.16 to the average meal cost of $16. On a more expensive meal of $50 for example, the added cost would only be $0.50. The median Meals Tax rate in Virginia is 5%. Among cities alone, the median is 6%.
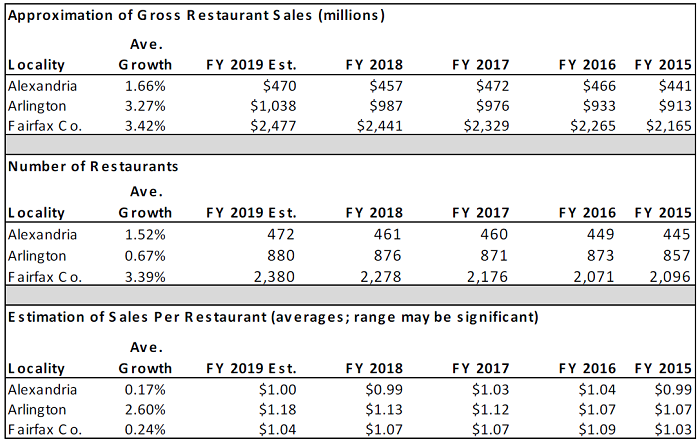
Since the rate increase, Alexandria restaurants have shown positive growth to date. For the first six months of FY 2019, gross sales for Alexandria restaurants are approximately $244.0 million, up 1.97% over the $239.3 million in the first six months of FY 2018.
This compares to approximately $497 million in the first six months of FY 2019 in Arlington County, which reflects an increase of approximately 1.7%. Fairfax County does not levy a Meals tax, and restaurant information is not available for the first six months.
The following chart provides historical Meals tax data over the last four fiscal years. County data is an approximation, extrapolating from annual BPOL data:

On average, the City is showing positive growth in average sales per restaurant. Market fluctuations may be attributable to many things, not just tax rate elasticity. For example, the average City sales per restaurant increased in FY 2016, and decreased in FY 2017 and 2018, at a time of constant tax rates. Likewise, the average sales in Fairfax decreased in FY 2017, and is estimated to be slightly down in FY 2019, and yet that jurisdiction has no Meals Tax.
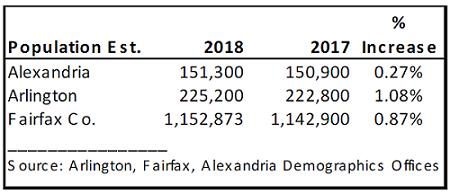
The following table provides our comparative population trend:

The following table provides comparative labor market trends:

Source: Labor Market Information, Community Profile, Virginia Employment Commission
Quarterly Census of Employment and Wages (QCEW) for Multiple Industries for workers covered by State unemployment insurance and Federal workers covered by the Unemployment Compensation for Federal Employees. Employment data under the QCEW program represent the number of covered workers who worked during, or received pay for, the pay period including the 12th of the month. Excluded are members of the armed forces, the self-employed, proprietors, domestic workers, unpaid family workers, and railroad workers covered by the railroad unemployment insurance system.
Of the above data, the VEC shows the following when isolating just on the business category of “Accommodation and Food Services:”

Per the VEC, the “Accommodation and Food Services” sector comprises establishments providing customers with lodging and/or preparing meals, snacks, and beverages for immediate consumption.
The following table provides commercial vacancy rate data:

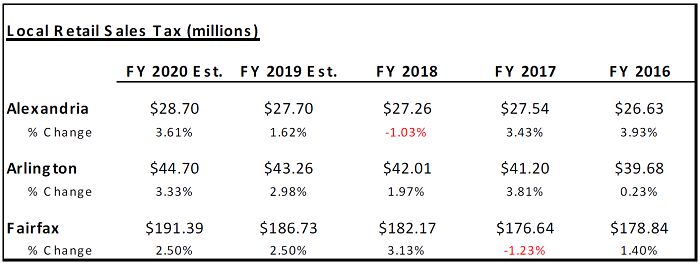
The following table provides historical Sales tax data:

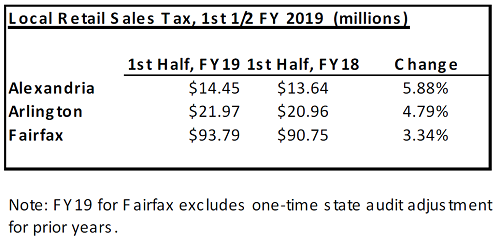
Finally, the following table provides Sales tax data for the first six months of FY 2019:
