[Archived] Question #9: What is the additional debt capacity in the proposed new debt policy beyond what is being proposed in the CIP?
Question:
What is the additional debt capacity in the proposed new debt policy beyond what is being proposed in the CIP?
Response:
The Proposed FY 2018 – FY 2027 CIP includes recommended changes to the City’s debt policies. The changes recommended are outlined below:

The Proposed CIP includes $769.6 million in borrowing related to City projects (excluding borrowing related to Sanitary Sewers and Stormwater Management) and schools-related projects over the 10-year plan. This amount of borrowing is compliant with the proposed new debt policies, while leaving adequate room to allow the City to use debt financing to react to unknown or unexpected capital infrastructure needs that may arise in the future.
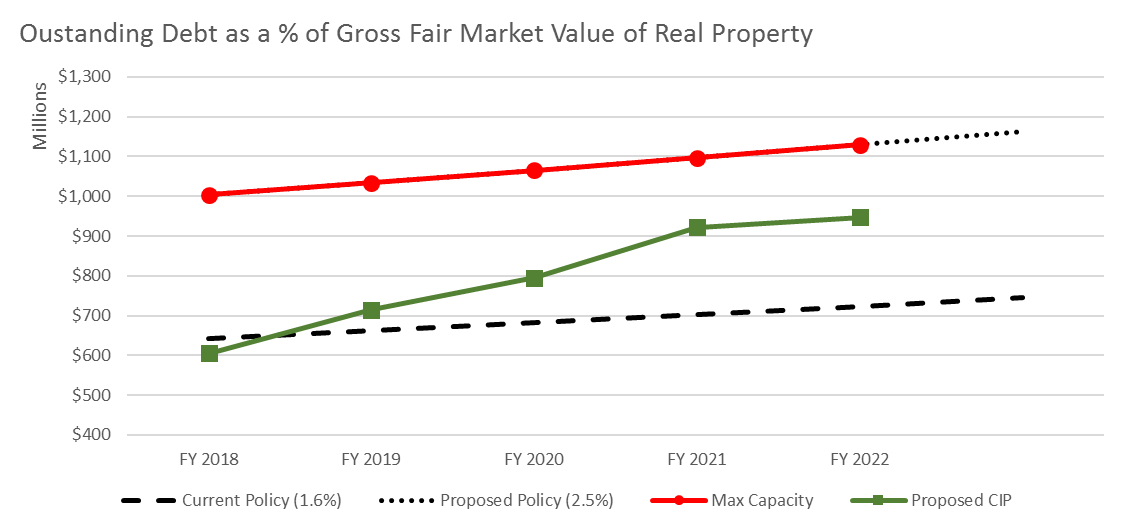
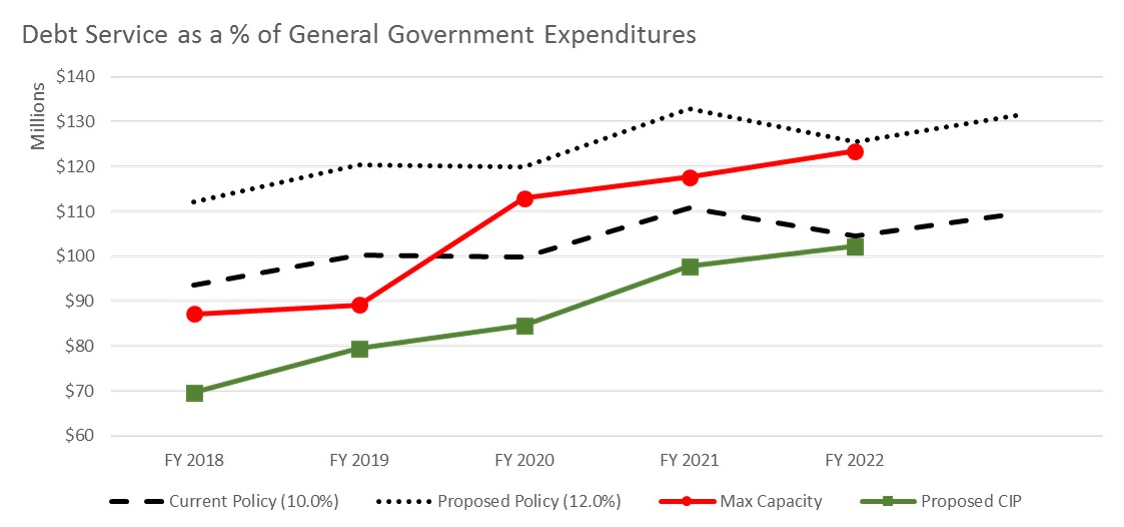
The analysis below demonstrates the additional borrowing capacity, within the proposed debt polices, that the City would be able to utilize should City Council decide to increase the City’s borrowing in the CIP. This is a mathematical statement of the amount of borrowing that would achieve the maximum debt allowable under the proposed new policy in all years. It is not a recommendation of staff. This theoretical scenario would produce an unreasonably large issuance in year one that would leave no additional capacity to address potential unforeseen needs in future years and require reductions in future planned issuances due to the capacity consumed in year one. It would also increase debt service in the operating budget by $10-$28 million per year over the next five years.

Between FY 2018 and FY 2022, the proposed debt policies would allow for an additional $219.9 million of borrowing. Consequentially, this results in an additional $96.7 million in debt service over the five-year period to address increased principal and interest payments.
As illustrated in the charts below, the early years of the City’s maximum debt capacity are controlled by the Debt as a Percentage of Real Property Value ratio. However, as the scenario progresses toward FY 2022, Debt Service as a Percentage of General Government expenditures becomes the limiting ratio. If this analysis were continued out to FY 2027, Debt Service as a Percentage of General Government Expenditure would be the limiting ratio for FY 2023 – FY 2027.


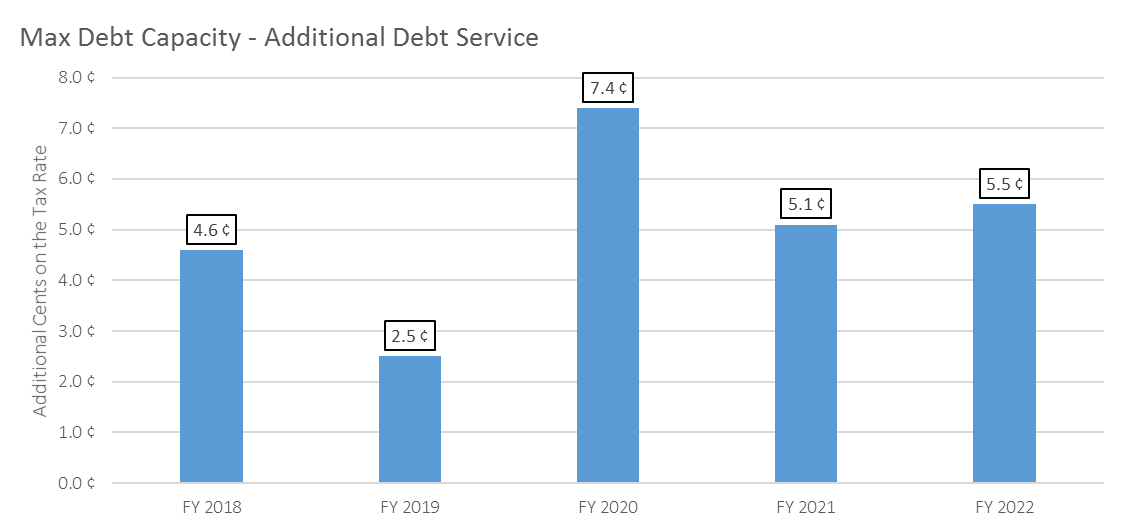
The chart below shows the impact of the additional debt service that would result from pursuing a maximum debt capacity scenario represented in cents on the real estate tax rate.

In FY 2018, a maximum debt capacity scenario would represent an additional 4.6 cents on the real estate tax rate. For the average homeowner in Alexandria, this would represent an additional $243 annually on their real estate tax bill, a 4.3% increase. This amount would be above and beyond the $197 impact that the average homeowner could expect from their CY 2017 assessment increase (1% increase) and the 2.7 cents increase (2.6% increase) included in the Proposed FY 2018 Budget. In total, the average homeowner in Alexandria could expect their real estate tax bill to increase $440 (7.8%), if the maximum debt capacity scenario was pursued.